This article documents an advanced feature of VisionScript that is not necessary for most users.
VisionScript features a built-in debugger for understanding how your code works and finding the source of errors.
The debugger triggers when a Breakpoint[] runs in a program. This command stops your code in place and creates an interactive environment in which you can debug.
To debug a program, first add a breakpoint to your script:
Load["./image.jpg"]
Detect["cat"]
Count[]
Breakpoint[]
Say[]
Then, run your program:
visionscript program.vic
When your program reaches the breakpoint, the debugger will trigger.
The debugger looks like this:
[n,p,q,s,r,h] VisionScript Debug Mode >
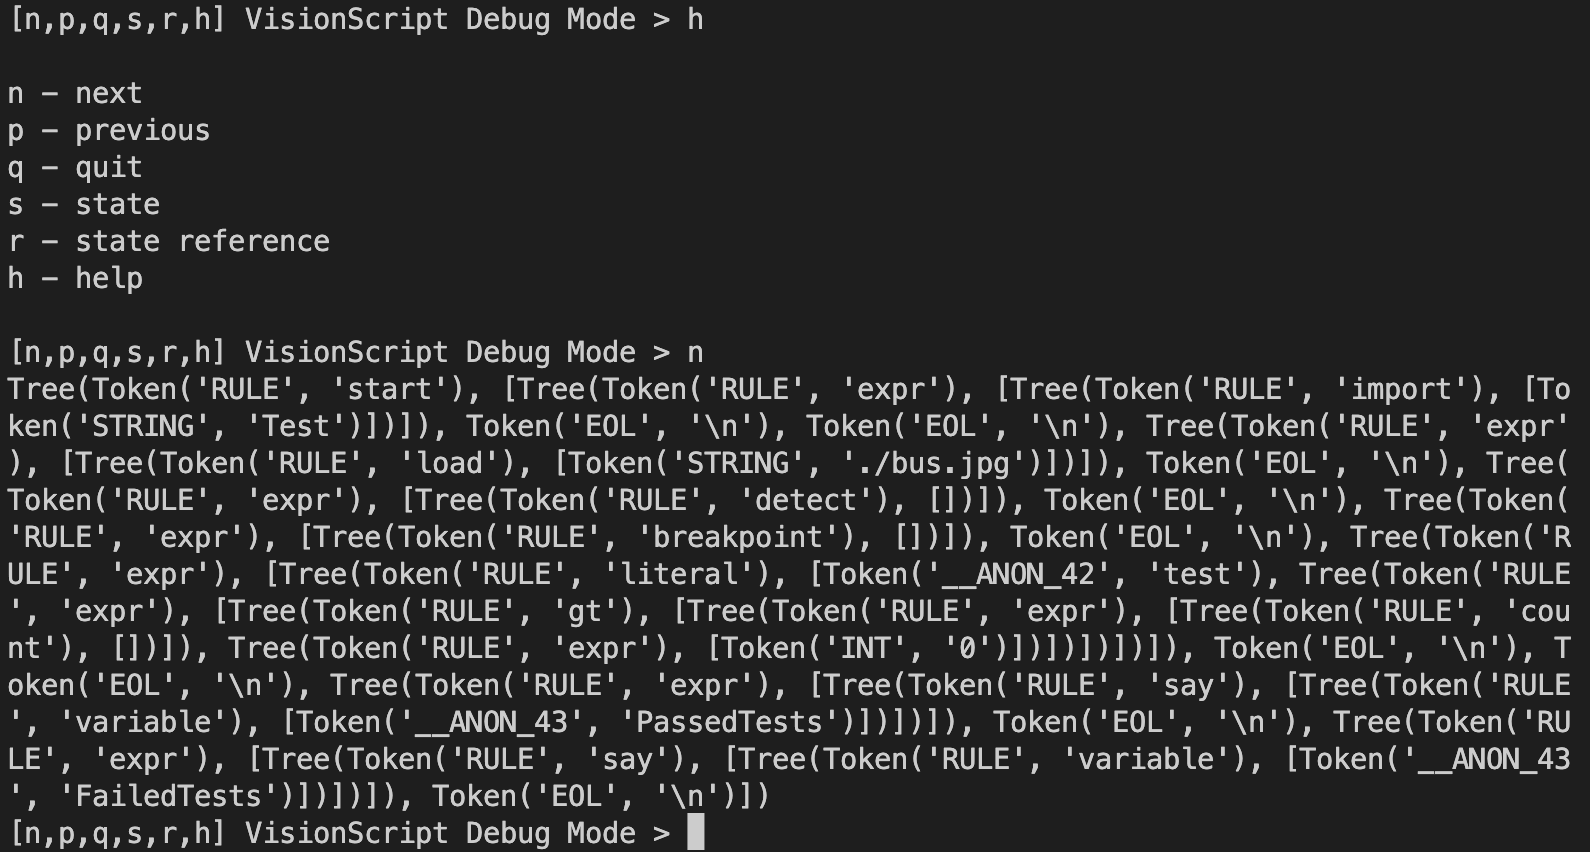
The letters at the beginning are commands, which mean:
n: Prints the abstract syntax tree for the current line. Run the current line and go to the next one.p: Go to the previous line.q: Quit the debugger. This will start running your code until another breakpoint is run, if any. If no breakpoints are run, the program will run to completion.r: List values in state that you can access.s [state_value]: Show the value of a state. For example,s detections_stackwill show the value of thedetections_stackstate.h: Show help.